12 Jul 2026
Tracing Volatility Thresholds in Blended Advisory Networks for Equine Events and League Contests
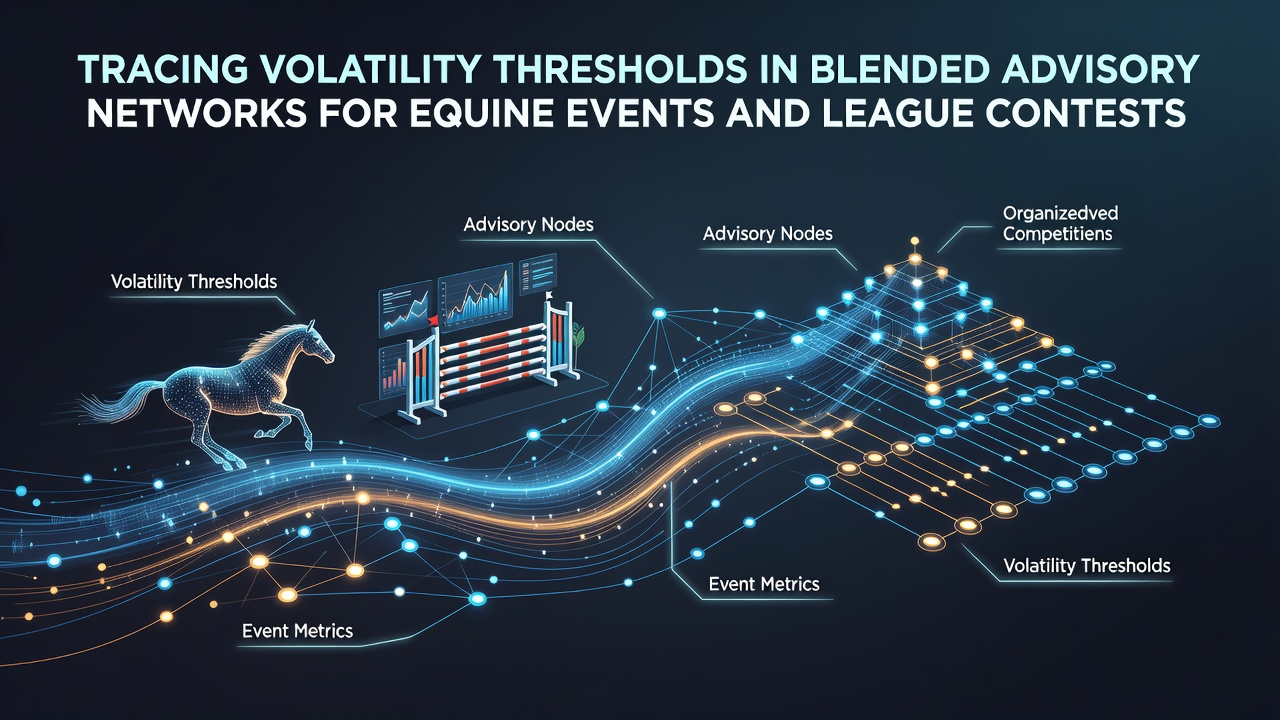
Blended advisory networks combine recommendations across equine events and league contests to create diversified selection pools, and observers note that these structures require careful monitoring of volatility thresholds where return variance begins to exceed acceptable parameters. Researchers have examined data sets spanning multiple seasons and found that thresholds often emerge when standard deviation in weekly yields surpasses 12 percent, particularly when horse racing selections from turf trials mix with soccer or rugby league outcomes from pitch contests.
Defining Volatility in Mixed Advisory Systems
Volatility thresholds represent the points at which fluctuations in performance metrics shift from normal variation to patterns that demand adjustment in allocation strategies, and studies conducted by academic teams at the University of Sydney have mapped these levels through longitudinal analysis of tipster portfolios. Data from those investigations shows that equine selections tend to exhibit higher single-event variance due to factors like track conditions and field sizes, whereas league contests introduce correlation risks when multiple matches occur within the same round. When both categories operate within one network, the combined effect can push overall portfolio deviation higher unless explicit caps are applied at the individual service level.
Measurement Approaches Used by Analysts
Analysts track volatility through rolling calculations that incorporate win rates, average odds, and drawdown sequences, and figures from industry reports indicate that blended networks benefit from separate tracking layers for each sport before aggregation. One common method applies a 20-week moving window to calculate coefficient of variation, which normalizes standard deviation against mean return and allows comparison across services with different risk profiles. In July 2026 several platforms began publishing these metrics publicly after regulatory updates in Australia required clearer disclosure of performance dispersion, a change that prompted independent verification by research groups.
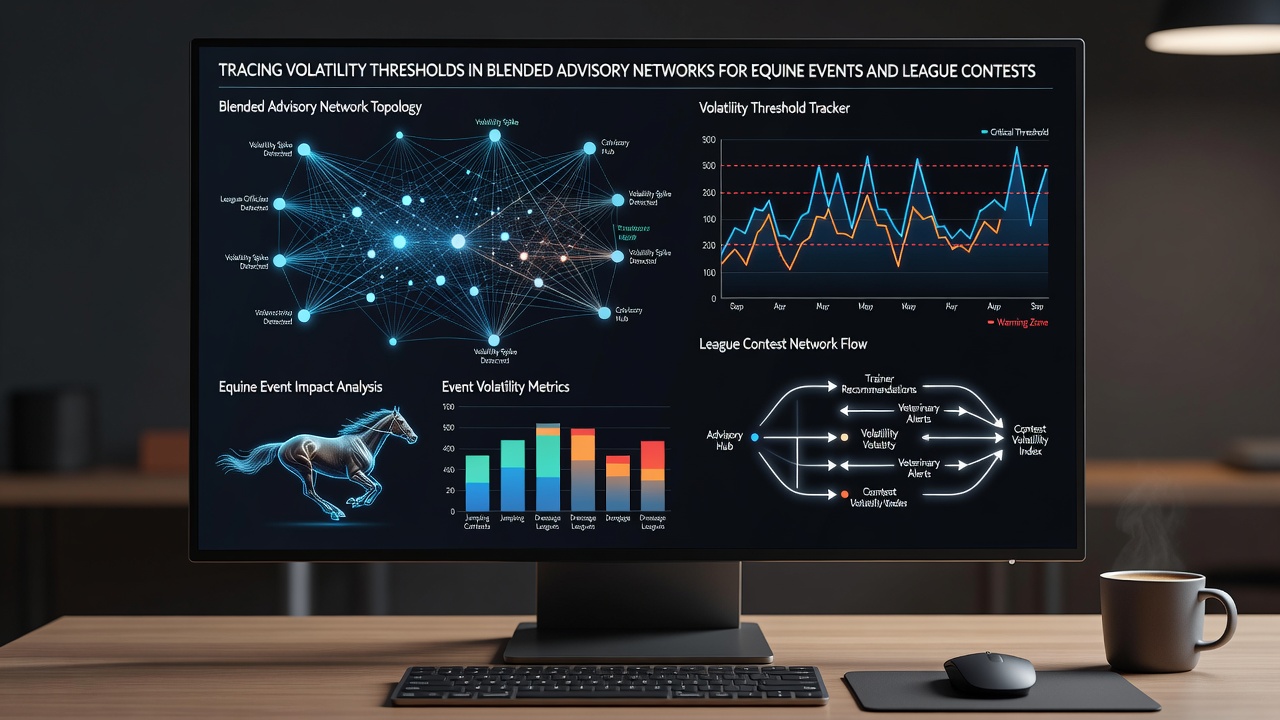
Threshold detection also relies on stress testing that simulates sequences of consecutive losses drawn from historical distributions, and evidence from Canadian regulatory filings reveals that networks maintaining separate buckets for equine and league selections reduce breach frequency by approximately 18 percent compared with fully merged pools. Those findings align with earlier work from the University of Nevada Las Vegas Center for Gaming Research, which examined similar diversification effects in multi-sport advisory models.
Network Architecture and Threshold Sensitivity
Advisory networks that blend equine and league inputs often employ weighting algorithms that adjust exposure based on recent volatility readings, and operators report that lowering equine allocation when its rolling deviation exceeds league levels helps keep overall variance within bounds. Data shows that services using dynamic rebalancing cross volatility thresholds less frequently than static allocation models, although the computational overhead increases. Observers note that July 2026 saw several European platforms adopt these rebalancing rules after industry associations released guidelines on risk communication for multi-sport offerings.
Correlation between equine and league outcomes remains low in most datasets, which supports the diversification premise, yet clustered events such as major racing festivals coinciding with league cup rounds can temporarily elevate joint variance. Research indicates that networks incorporating correlation matrices into their threshold models achieve more stable capital curves over multi-year periods, and one Australian study tracked 47 blended services through the 2024-2026 window to confirm this pattern.
Practical Implications for Network Operators
Operators who monitor volatility thresholds in real time gain the ability to pause or scale specific input streams before cumulative effects compound, and case examples from platform telemetry demonstrate that early detection reduces the depth of subsequent drawdowns. Thresholds are not fixed across all networks because they depend on average odds offered, service tenure, and the proportion of each sport within the blend. Figures compiled by European trade groups show that networks with equine weightings above 60 percent encounter threshold events roughly 1.4 times more often than those maintaining a 40-60 split.
Automated alerts triggered at predefined deviation levels allow human oversight teams to review selection sources before further capital deployment occurs, and several large platforms implemented such systems during 2025 after internal audits revealed recurring breach patterns. The approach integrates with existing performance dashboards rather than requiring separate infrastructure, which keeps implementation costs contained while improving transparency for participants.
Conclusion
Tracing volatility thresholds in blended advisory networks requires consistent measurement across equine events and league contests, and the evidence indicates that separate tracking combined with dynamic allocation reduces the frequency and severity of variance spikes. Continued refinement of these methods through academic and industry collaboration supports more stable outcomes for participants who rely on multi-sport advisory structures.