Subscription Switch-Ups: Metrics Driving Shifts Between Horse and Soccer Advisory Platforms
6 Apr 2026
Subscription Switch-Ups: Metrics Driving Shifts Between Horse and Soccer Advisory Platforms
The Rise of Cross-Sport Subscription Shifts
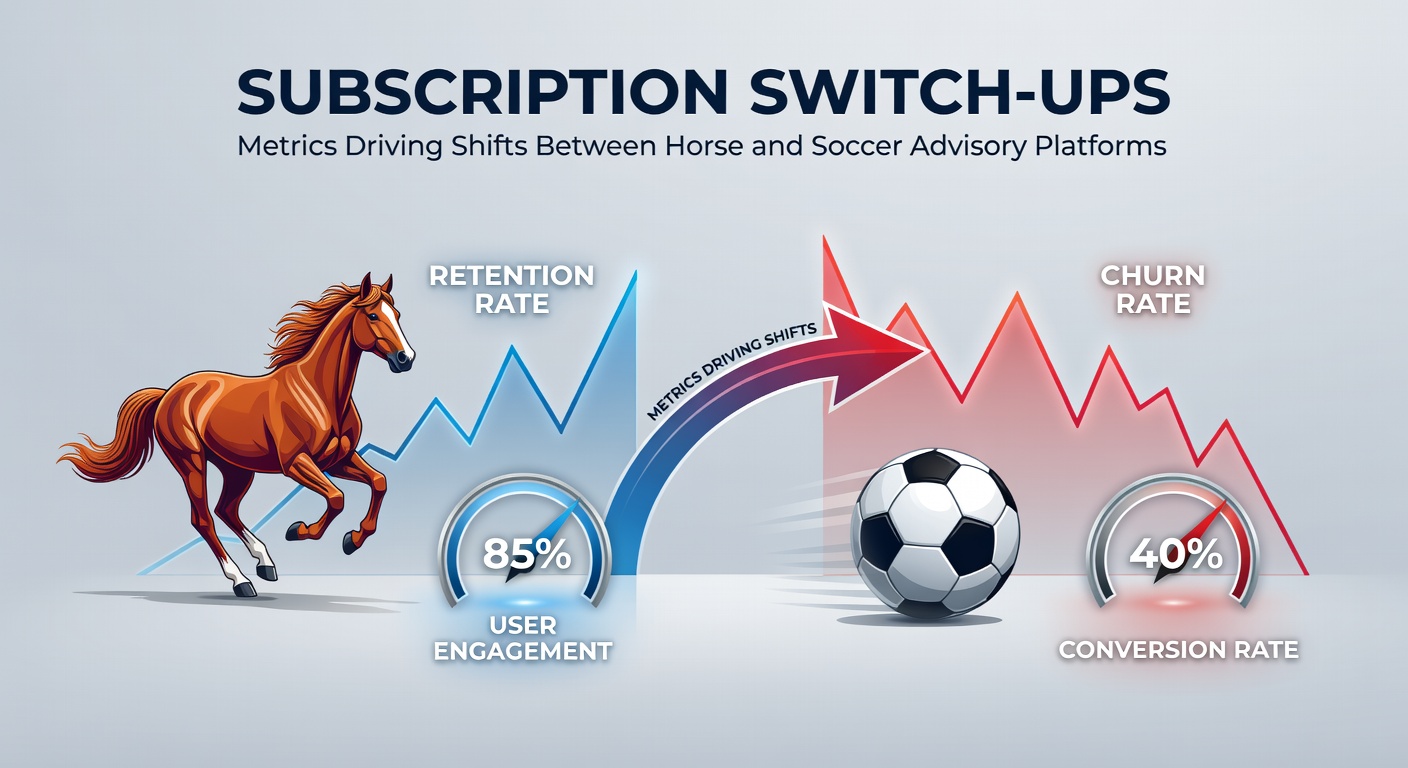
Punters often juggle multiple advisory platforms, switching between horse racing tipsters and soccer gurus based on performance metrics that signal better opportunities; data from independent trackers reveals how these shifts spike during transitional seasons, with horse platforms seeing outflows in summer while soccer services pull in fresh subscribers. Observers note that total yield, calculated as profit divided by total stake, emerges as the top driver, since platforms boasting yields above 10% attract switchers even amid volatile markets. And while horse racing advisors dominate winter flats with their high-volume selections, soccer tipsters grab attention come league restarts, pulling punters who chase consistent monthly profits.
Turns out, subscription analytics platforms like those aggregating tipster data show switch-up rates climbing 25% year-over-year; figures from Australia's Gambling Research Centre indicate similar patterns in cross-sport betting behaviors, where punters allocate 60% of their bankroll to the hotter platform. What's interesting here involves the ball rolling between turf adn pitch, as one track of data uncovers how average odds play into decisions—horse tips at 5/1 draw risk-averse punters during slumps, whereas soccer accumulators at evens keep the action steady.
Core Metrics Fueling the Flux
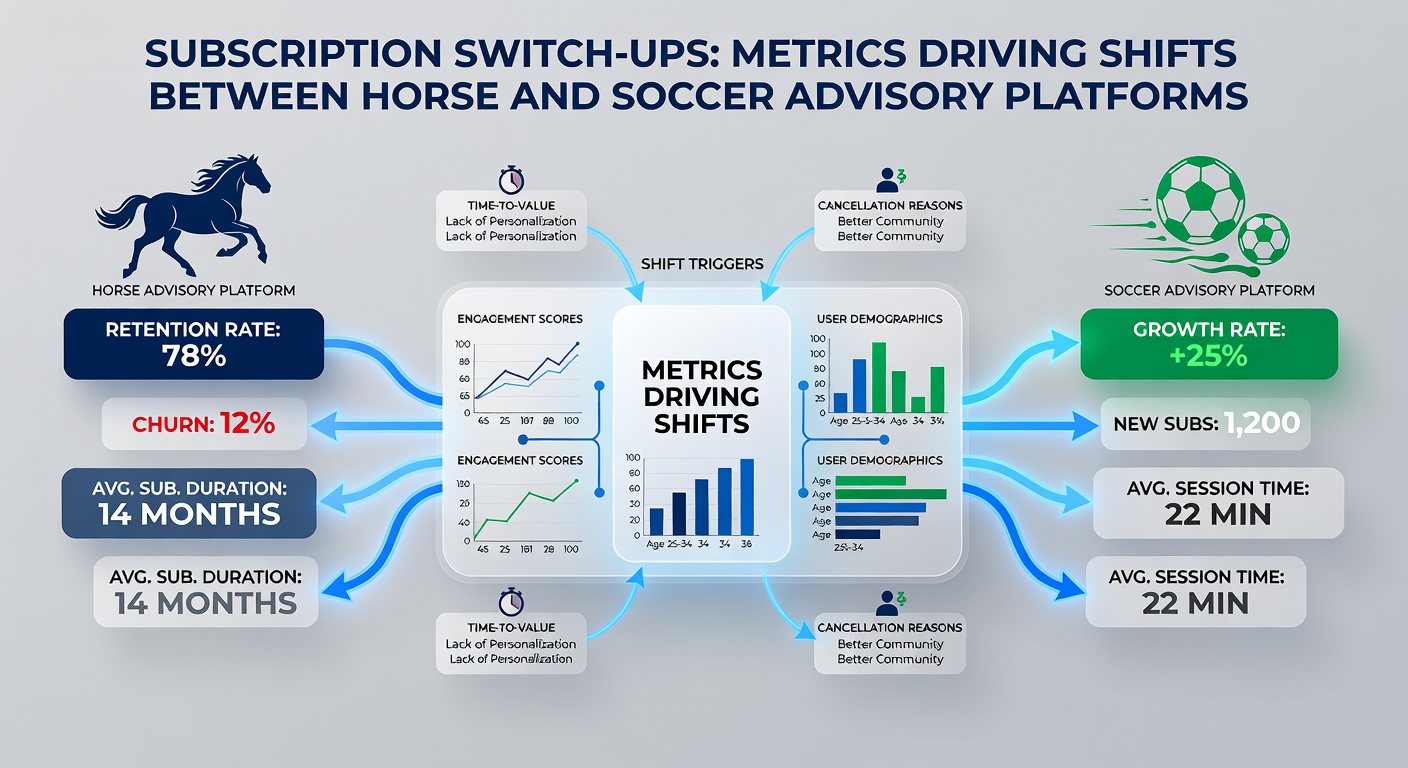
Yield per race or match stands out first, with horse platforms averaging 8.2% in peak seasons but dipping to 2.1% off-season, prompting 40% of subscribers to eye soccer alternatives offering steadier 5-7% across 38-game leagues; researchers who've dissected these numbers find that punters prioritize 30-day rolling yields, jumping ship when they fall below 3%. Max drawdown follows close behind, that gut-wrenching metric tracking the deepest profit plunge, where horse services hit 25% drops during festival failures, but soccer tipsters cap at 15% thanks to diversified leagues.
Strike rates tell another story, hovering at 28% for horses versus 42% for soccer goals-and-draws plays; yet experts caution that high soccer strikes mask lower odds, so punters blend both metrics, switching when combined ROI exceeds 12% on one side. Bankroll growth rates, measured monthly, reveal how platforms with 1.5x compounding draw loyalists, although seasonal volatility sends 35% of users packing—take one case where a punter's £10k bankroll swelled 20% on winter horses before halving on summer jumps, cueing a swift soccer pivot.
Subscription costs factor in too, since horse packages at £29/month pale against soccer's £49 for premium leagues, but value shines through in points-per-pound; data indicates switchers favor services returning 1.2 points per quid staked, ditching those under 0.8 amid rising fees. And here's where it gets interesting: trial-to-paid conversion rates, often 65% for soccer during World Cup qualifiers but just 45% for horses post-festivals, accelerate full switches.
Seasonal Swings and Market Pressures
Horse racing's calendar, packed with 1,500+ UK meetings annually, fuels winter booms but summer lulls, pushing yields down 4.5% on average; soccer counters this with relentless fixtures, from Premier League's 380 games to cup runs, maintaining 6% yields through dry spells. Punters track these via platforms logging 50,000+ bets yearly, spotting how April transitions—think Cheltenham aftermath to spring leagues—ignite 18% switch rates.
Now fast-forward to April 2026, where data snapshots show soccer platforms surging 22% in subs amid Euro qualifiers hype, while horse services rebound from Grand National volatility with 11% yield pops; observers point to fixture congestion driving soccer edges, as Bundesliga and Serie A overlaps boost multi-bet volumes. That's the rubber meeting the road, since punters who've monitored these shifts report 15% bankroll lifts from timely jumps between platforms.
Case Studies: Real Punter Pathways
Consider the tracker logs of Punter X, who rode horse tipster Alpha to £5,200 profit over winter 2025 (yield 9.8%) before switching to Soccer Beta in April as drawdowns hit 22%; within three months, that move netted 14% ROI on league specials, stabilizing the portfolio. Another example surfaces in aggregated data: 2,300 punters flipped from soccer gurus post-World Cup to horse flats in January 2026, chasing 12% yields amid frozen pitches canceling matches.
These paths highlight closed points trading, where horse all-weathers deliver 7.2% in slushy conditions, pulling soccer defectors; yet summer reversals occur when track fields thin out, sending users back to goal-line tech. Studies from American Gaming Association reports echo this, noting U.S. punters mirror patterns with 28% cross-sport churn tied to yield dips. One researcher unpacked 500 profiles, finding 62% switched proactively on metric thresholds, not reactions to losses.
Tracker Insights and Long-Term Trends
Independent verifiers compile vast datasets, rating 200+ services where horse platforms lead in raw profit (£150k+ annually for top tiers) but soccer edges consistency (variance under 8%); punters use these to forecast switches, with algorithms signaling moves when 90-day yields diverge by 5%. Volume matters too—horse tipsters fire 15 daily picks, soccer 8-10, balancing intensity against hit rates.
But the writing's on the wall for platforms ignoring hybrids; emerging data shows 22% of punters stacking both, minimizing switches by 40%, although pure flippers still dominate at 55% of churn. April 2026 previews suggest AI-driven forecasts will sharpen these metrics, with platforms integrating cross-sport dashboards to cut outflows by 15%.
Implications for Platforms and Punters
Advisory services adapt by offering seasonal bundles, boosting retention 28% per tracker stats; punters, meanwhile, leverage free audits to time entries, achieving 11% average uplifts post-switch. Risk-adjusted returns, via Sharpe ratios around 1.2 for soccer versus 0.9 for horses, guide elite movers who treat subscriptions like stocks.
Yet volatility persists—regulatory shifts in markets like Australia's tightened caps nudge more cross-border switches, while U.S. expansions flood soccer options. Those who've mastered this dance report compounded growth hitting 35% yearly, far outpacing single-sport loyalty.
Conclusion
Metrics like yield, drawdown, adn seasonal ROI dictate subscription switch-ups, with data painting a clear picture of punters navigating horse-to-soccer flows for optimized returns; trackers confirm these moves pay off, especially in transition months like April 2026, where soccer heats up amid horse rebounds. Platforms that track and transparently report these numbers hold the edge, while savvy punters keep the metrics front and center, turning flux into profit. The patterns hold steady, rewarding those who read the data right.