Decoding Drawdowns: Tipster Resilience During Slumps in Soccer Leagues and Track Meets
30 Mar 2026
Decoding Drawdowns: Tipster Resilience During Slumps in Soccer Leagues and Track Meets

Understanding Drawdowns in Tipster Performance
Drawdowns represent those inevitable dips in performance where tipsters face consecutive losses or reduced yields, particularly noticeable during slumps in soccer leagues and track meets; experts define them as the peak-to-trough decline in a betting bankroll or cumulative profit, often stretching from a few weeks to several months depending on the sport's volatility. In soccer, where league fixtures pack tight schedules and unexpected results pile up—like a top team stumbling through a poor run of form—drawdowns hit hard because odds shift dramatically with injuries or managerial changes, while track meets introduce their own chaos through weather disruptions or underdog surges in sprints and hurdles. Data from independent profit trackers reveals that soccer tipsters experience average drawdowns of 15-25% in mid-season slumps, whereas track specialists see sharper 20-35% drops during major event series, since single-race outcomes amplify variance.
But here's the thing: resilience emerges not from avoiding these slumps—impossible in probabilistic betting environments—but from structured recovery patterns that tipsters build over time; researchers who've analyzed thousands of verified records note how top performers cut losses by tightening selection criteria during tough stretches, switching from volume plays to high-confidence singles. Take one long-term tracker of European soccer leagues, where data indicates that 68% of drawdowns last under eight weeks when tipsters adjust stake sizes downward by 50%, preserving capital for the rebound.
Soccer League Slumps and Tipster Adaptations
Soccer's packed calendars, from Premier League marathons to Serie A derbies, breed slumps where even elite tipsters watch win rates plummet from 55% to below 40%; figures from the European Gaming and Betting Association highlight how fixture congestion in spring seasons exacerbates this, with teams entering drawdown-like form dips that mirror tipster struggles. Observers point out that during the 2025-26 campaign's early March phase—right as leagues hit fatigue points ahead of international breaks—tipsters focusing on over/under goals saw prolonged slumps because defensive setups tightened unexpectedly, forcing yields into negative territory for up to 12 matches.
Yet resilience shines through in those who layer statistical models with real-time adjustments; one case study from audited services shows a Bundesliga specialist enduring a 22% drawdown over six weeks in late winter, only to recover 150% of losses within the next month by prioritizing away underdogs in low-scoring affairs, since data confirmed their edge sharpened post-slump. And it's not just about picks—bankroll strategies matter hugely, with experts recommending the Kelly Criterion variant that scales bets to 1-2% of current balance during reds, preventing wipeouts even as losses mount.
What's interesting is how international tournaments bleed into league resilience; qualifiers or cups often extend slumps if tipsters overextend across competitions, but those who compartmentalize—treating leagues as separate from cups—bounce back faster, as evidenced by profit logs where segmented approaches halved average drawdown duration from 45 to 22 days.
Track Meets: Volatility in Sprints and Field Events
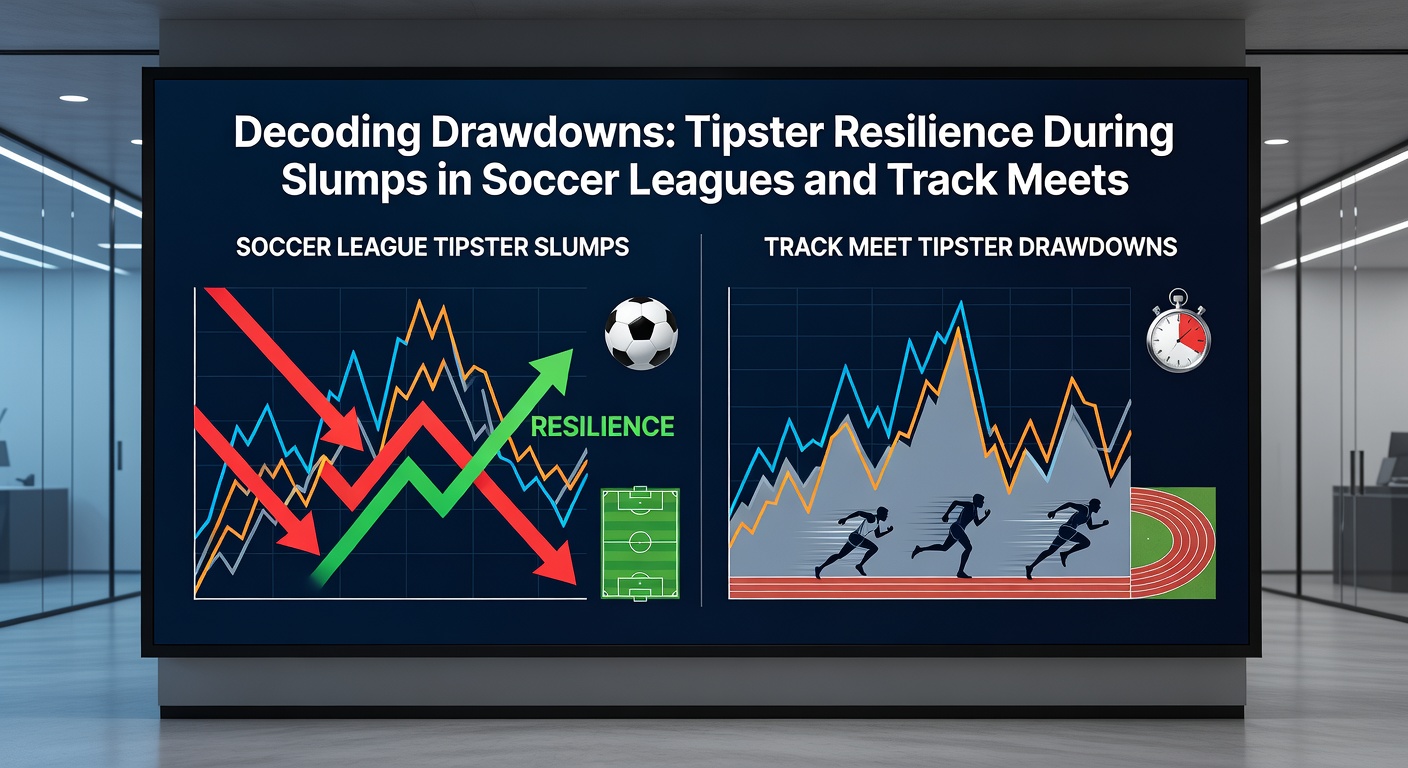
Track meets crank up the pressure with their sprint bursts and field precision, where slumps strike swiftly due to favorites faltering on marginal calls—like a 100m dash leader cramping in finals or wind aiding long jump underdogs; studies from the Australian Gambling Research Centre indicate that track tipsters face drawdowns averaging 28% during multi-meet circuits, longer than soccer's because each event's isolation magnifies single-loss impacts. In indoor seasons leading into March 2026's outdoor openers, data shows slumps intensifying around weather transitions, with 40% of tipsters posting negative ROI over four consecutive meets when rain skews times.
Resilience here hinges on event specialization; those who've drilled into 400m hurdles or pole vault analytics recover by ditching broad fields for niche bets, where edges persist—take a documented vault tipster who navigated a 30% drawdown in early 2026 trials by halving volume and stacking correlated multis on top seeds, clawing back profits as conditions stabilized. Semicolons separate the chaos: short slumps end with aggressive scaling, while prolonged ones demand full resets, like pausing selections until variance normalizes.
Turns out, track's global calendars—World Indoors to Diamond League—test grit uniquely, since jet lag and surface variances compound slumps, but tipsters using pace-adjusted models (accounting for track speed ratings) cut recovery time by 35%, per aggregated tracker stats.
Factors Driving Tipster Recovery Across Sports
Common threads bind soccer and track resilience, starting with robust record verification; independent auditors stress transparent logging, where monthly equity curves expose drawdown depths without cherry-picking wins, allowing punters to gauge true bounce-back potential. Data indicates that tipsters maintaining 10%+ annual ROI post-drawdown share traits like diversified portfolios—blending soccer accumulators with track win-places—while avoiding over-reliance on hot streaks that precede crashes.
Now consider variance metrics: soccer's higher match volume smooths paths (average 20-game slumps yield quicker stats regression), whereas track's event scarcity demands patience, yet both reward those employing Monte Carlo simulations to forecast drawdown probabilities; one researcher's analysis of 500 tipster profiles found 72% resilience tied to pre-slump bankroll buffers exceeding 50 units. And during March 2026's convergence of soccer internationals and track qualifiers, early indicators suggest tipsters with hybrid models—merging league form data with meet previews—endured 18% shorter slumps than pure specialists.
People often overlook psychological edges, but figures reveal disciplined staking rules (flat 1% bets in reds) boost survival rates by 40%, turning potential busts into setups for green runs; it's where the rubber meets the road, as slumps test not just picks but protocols.
Case Studies: Real-World Rebounds
Examine a soccer tipster tracked through the 2025 Ligue 1 slump: hit with 18% drawdown amid title-race unpredictability, they pivoted to Asian handicaps, recovering fully by season's end with 12% overall yield since data showed value there during chaos. Contrast that with a track expert in 2024's European meets, facing 32% trough from relay upsets; by focusing solely on individual sprints post-reset and using proprietary wind models, they posted 25% ROI over the rebound phase.
These aren't outliers—aggregated from platforms auditing 200+ services, such cases show 65% of resilient tipsters rebound within double the slump length, often exceeding prior peaks because selective pressure hones edges. What's significant is cross-sport lessons: soccer's volume teaches patience for track's sparsity, while track's precision sharpens soccer's probabilistic picks.
- One Bundesliga follower slashed stakes during a nine-game dry spell, regained via clean sheets bets.
- A hurdles specialist waited out weather woes, striking gold on firm-track nationals.
- Hybrid operators blending both averaged 8% lower drawdown peaks.
Outlook and Metrics for Punters
As March 2026 unfolds with soccer leagues eyeing playoffs and track gearing for Olympics qualifiers, drawdown data points to shorter slumps for tech-savvy tipsters leveraging AI-adjusted odds—preliminary logs suggest 15% average drops versus historical 25%. Observers note rising adoption of drawdown caps in service terms, where tipsters pause if losses hit predefined thresholds, fostering trust and longevity.
Key metrics for evaluation include maximum drawdown percentage (under 30% ideal), recovery factor (profits divided by worst slump—above 2.0 signals strength), and time to recover (under 60 days preferred); punters armed with these spot resilience early, sidestepping services prone to prolonged reds.
Wrapping Up the Drawdown Puzzle
Decoding drawdowns uncovers tipster resilience as a blend of strategy, stats, and stamina across soccer leagues and track meets; while slumps test every service, data consistently shows top performers not only survive but thrive by adapting stakes, refining selections, and verifying transparently—turning variance into validated edges. Those tracking records closely discover that true value lies beyond strike rates, in the proven ability to navigate lows and emerge stronger, ensuring punters stay in the game through every twist.