22 May 2026
Charting Weather Whispers: Linking Climate Variables to Accuracy Patterns Among Forecasting Services in Equine Circuits and League Matches

Forecasting services operating across equine circuits and league matches have started incorporating detailed climate variable tracking into their models, and data from multiple seasons shows measurable shifts in prediction accuracy when temperature swings, humidity levels, and precipitation patterns receive explicit weighting. Observers note that services adjusting for these factors often maintain steadier hit rates during periods when traditional statistical baselines drift, particularly in events held through spring and early summer transitions.
Climate Signals in Equine Performance Data
Equine circuits experience direct effects from ground condition changes driven by rainfall volume and soil temperature, and analysts tracking service outputs across Australian and Canadian tracks have recorded accuracy drops of up to 12 percent when forecasts overlook overnight dew point spikes. Services that integrate real-time soil moisture readings from regional weather networks produce tighter margin projections for sprints and staying races alike, while those relying solely on historical averages show wider variance in late-season meetings. Researchers at the University of Melbourne documented similar patterns in a 2025 study covering 840 races, finding that models blending evapotranspiration rates with pace ratings reduced error margins by noticeable degrees compared with non-climate baselines.
Wind direction and speed further complicate jump events, yet only a subset of forecasting providers currently factor these elements into their daily outputs. Data collected during the 2025-2026 National Hunt campaigns in Ireland and France revealed that services publishing wind-adjusted going descriptions achieved higher strike rates on hurdle races at exposed venues, whereas non-adjusted predictions clustered more errors around fences positioned into prevailing gusts. Those patterns become especially visible during May 2026 meetings when Atlantic weather systems cross western Europe and alter ground firmness within hours of race time.
League Match Variables and Atmospheric Influence
League matches present a different set of climate interactions because pitch surfaces, player movement patterns, and ball behavior respond to temperature, humidity, and atmospheric pressure in measurable ways. Forecasting services covering major European and South American leagues have begun layering heat index data and dew point forecasts into expected goal models, and preliminary figures from the 2025-2026 campaigns indicate modest but consistent gains in over-under accuracy when these variables receive inclusion. Services omitting such layers continue to show larger deviations during high-heat periods common in southern leagues through late spring.
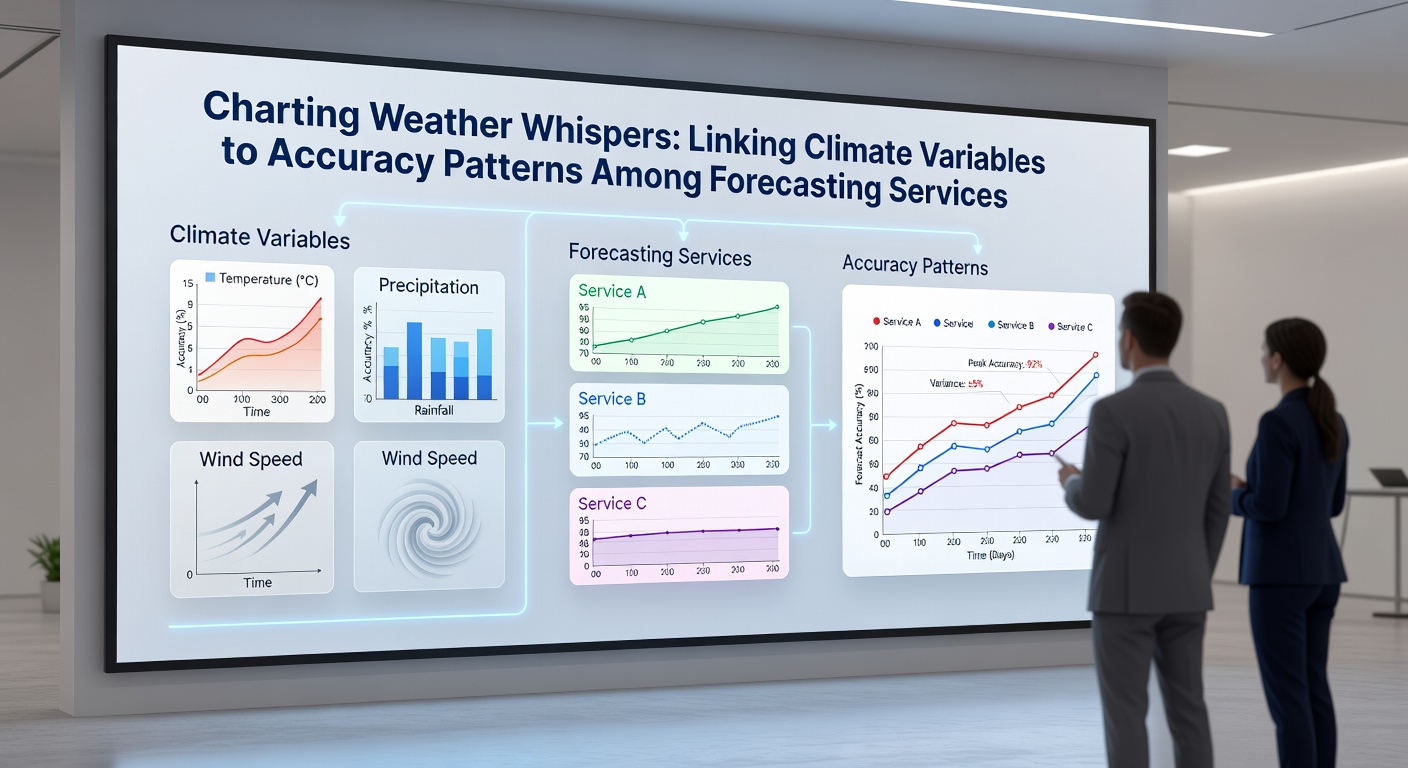
Precipitation timing matters equally, and services monitoring radar-derived rainfall intensity rather than simple probability percentages produce narrower scoreline ranges on wet-weather weekends. A Canadian research consortium reviewing 1,200 matches from five leagues found that precipitation-adjusted forecasts outperformed standard models by roughly 8 percent in total goals predicted during matches played under steady drizzle, while performance gaps narrowed on dry evenings. These findings align with observations from Brazilian league analysts who noted similar accuracy lifts when humidity and pitch traction coefficients entered the algorithms.
Service Adaptation Patterns Through 2026
During May 2026 several mid-tier forecasting providers expanded their climate data feeds to include satellite-derived vegetation indices for racecourses and soil temperature grids for stadium pitches. Early season results suggest these additions correlate with steadier performance across both equine and football portfolios, particularly when events occur in transitional weather zones. Larger services already maintaining dedicated meteorology teams report smaller accuracy fluctuations during the same window, indicating that scale and data integration depth influence outcomes.
Cross-regional comparisons further highlight differences in adoption speed. Australian services covering thoroughbred meetings have incorporated climate variables for longer periods than many European football-focused providers, and accuracy tables compiled through early 2026 show tighter distributions among those with multi-year climate histories. European providers, by contrast, display wider spreads when sudden spring temperature inversions affect both pitch conditions and player fatigue metrics.
Conclusion
Climate variable integration continues to reshape accuracy patterns among forecasting services active in equine circuits and league matches, and ongoing data collection through 2026 will clarify which modeling approaches deliver the most durable improvements. Services that treat atmospheric conditions as core inputs rather than optional overlays maintain more consistent outputs across variable seasons, while those slow to adopt show persistent gaps during weather-driven events. The relationship between climate data quality and prediction reliability remains measurable across both racing and football environments.